Asthma and air quality
Figure 16: Association between air quality and Asthma emergency visit
- In order to find the association between air quality and asthma emergency visit times, we use several different predictors and plot graphs.
- Based on the graphs, we can find that
air quality indexandozoneare with no relationships with asthma emergency visit times;CO,NO,SO2andPM2.5are with positive relationships with asthma emergency visit times. Thus, we can use those predictors for our modeling.
air quality index
asthma_air_graph1 =
  brfss_air2_df %>%
  ggplot(aes(x = mean_aqi_month, y = asthma_emergency)) +
  geom_point()+
  geom_smooth()

asthma_air_graph1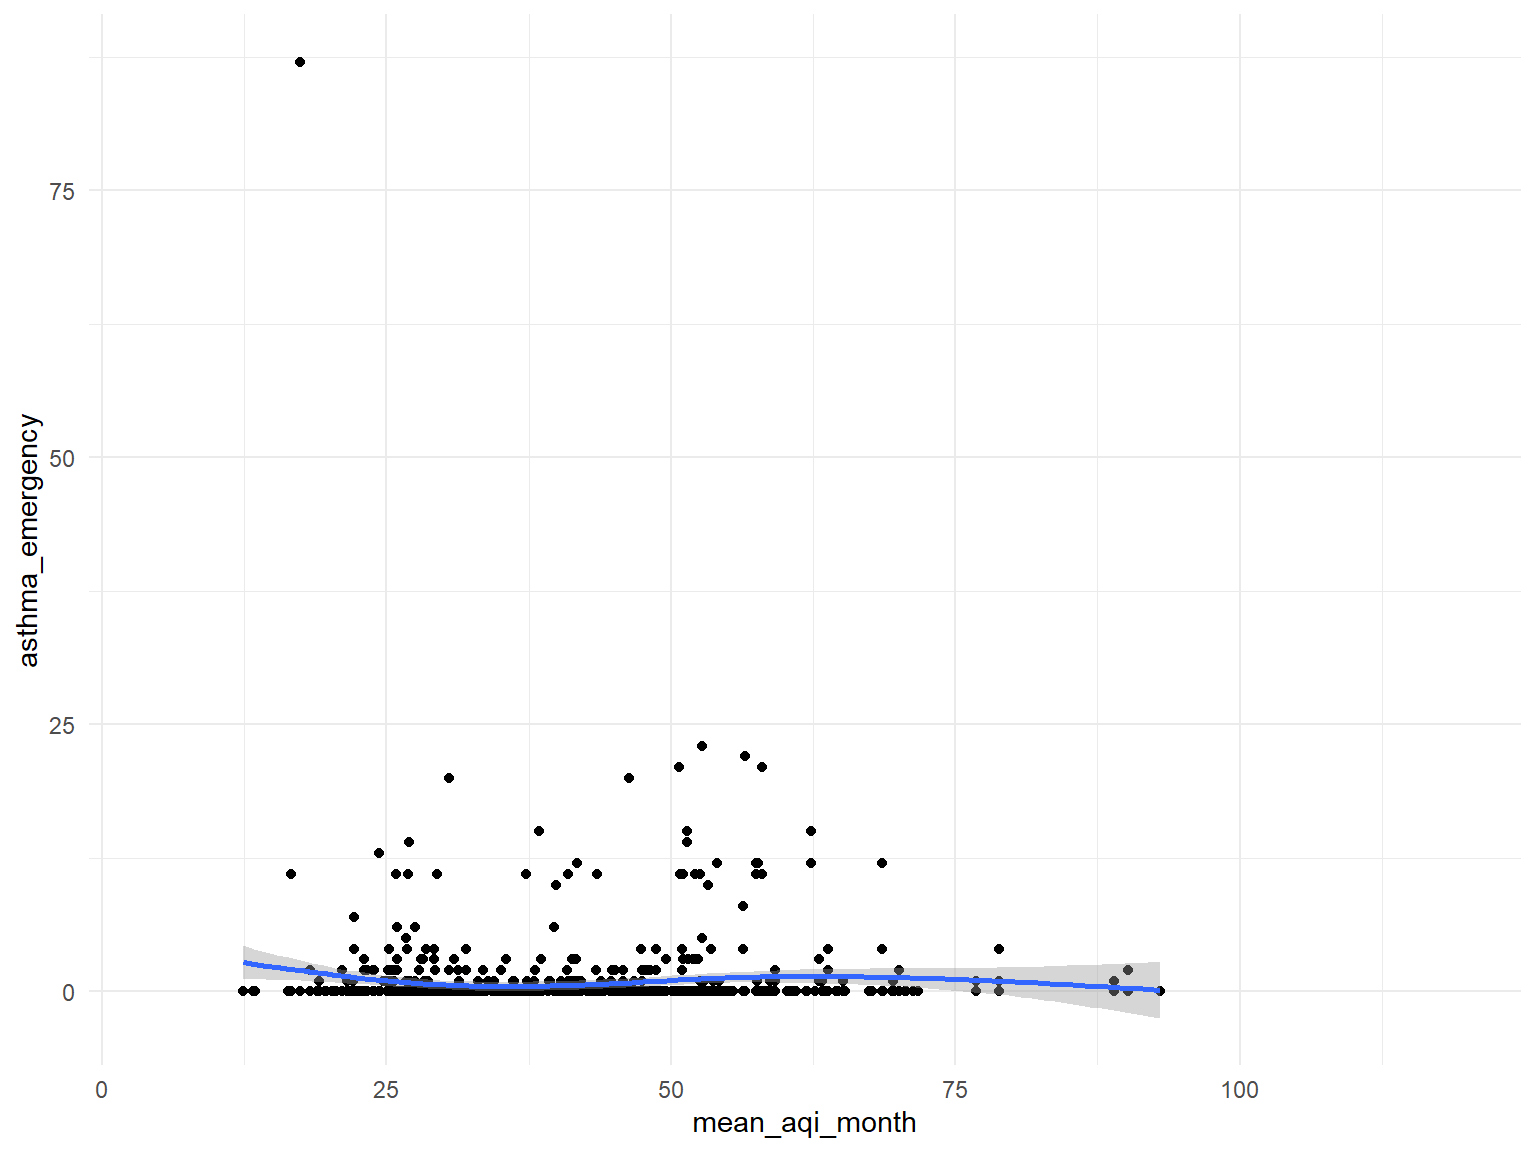
Ozone
asthma_air_graph2 =
  brfss_air2_df %>%
  ggplot(aes(x = mean_ozone_month, y = asthma_emergency)) +
  geom_point()+
  geom_smooth()

asthma_air_graph2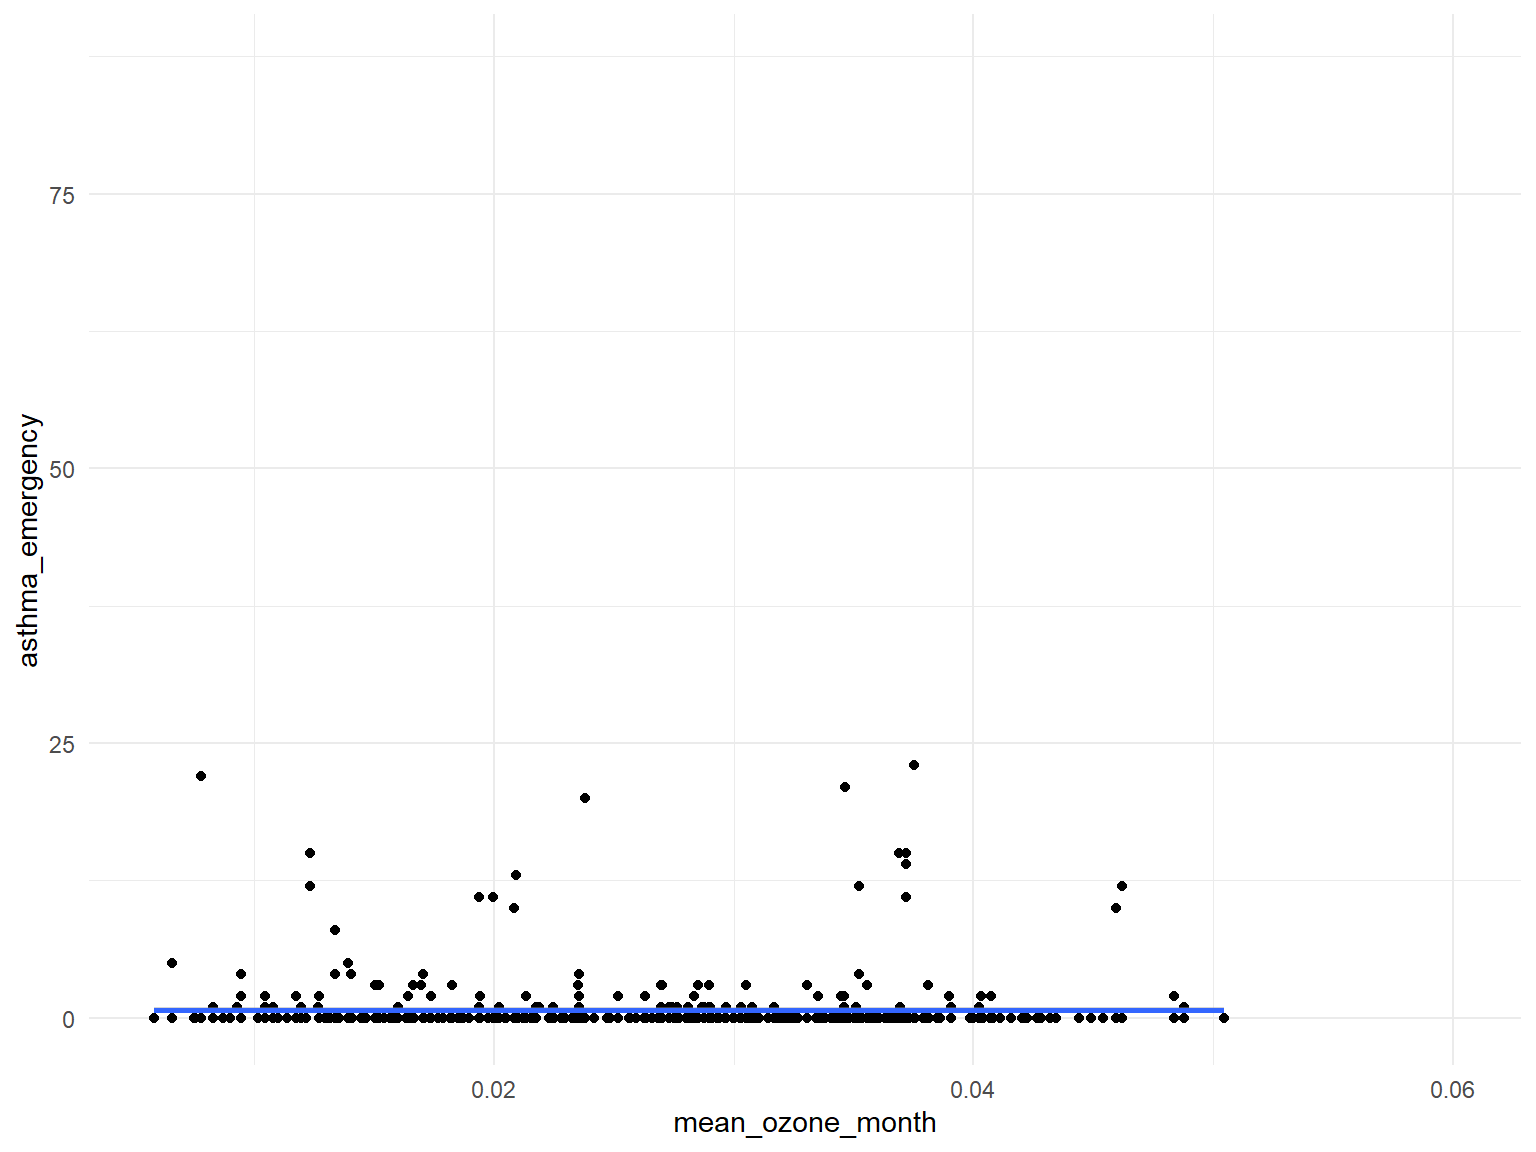
CO
asthma_air_graph3 =
  brfss_air2_df %>%
  ggplot(aes(x = mean_co_month, y = asthma_emergency)) +
  geom_point()+
  geom_smooth()

asthma_air_graph3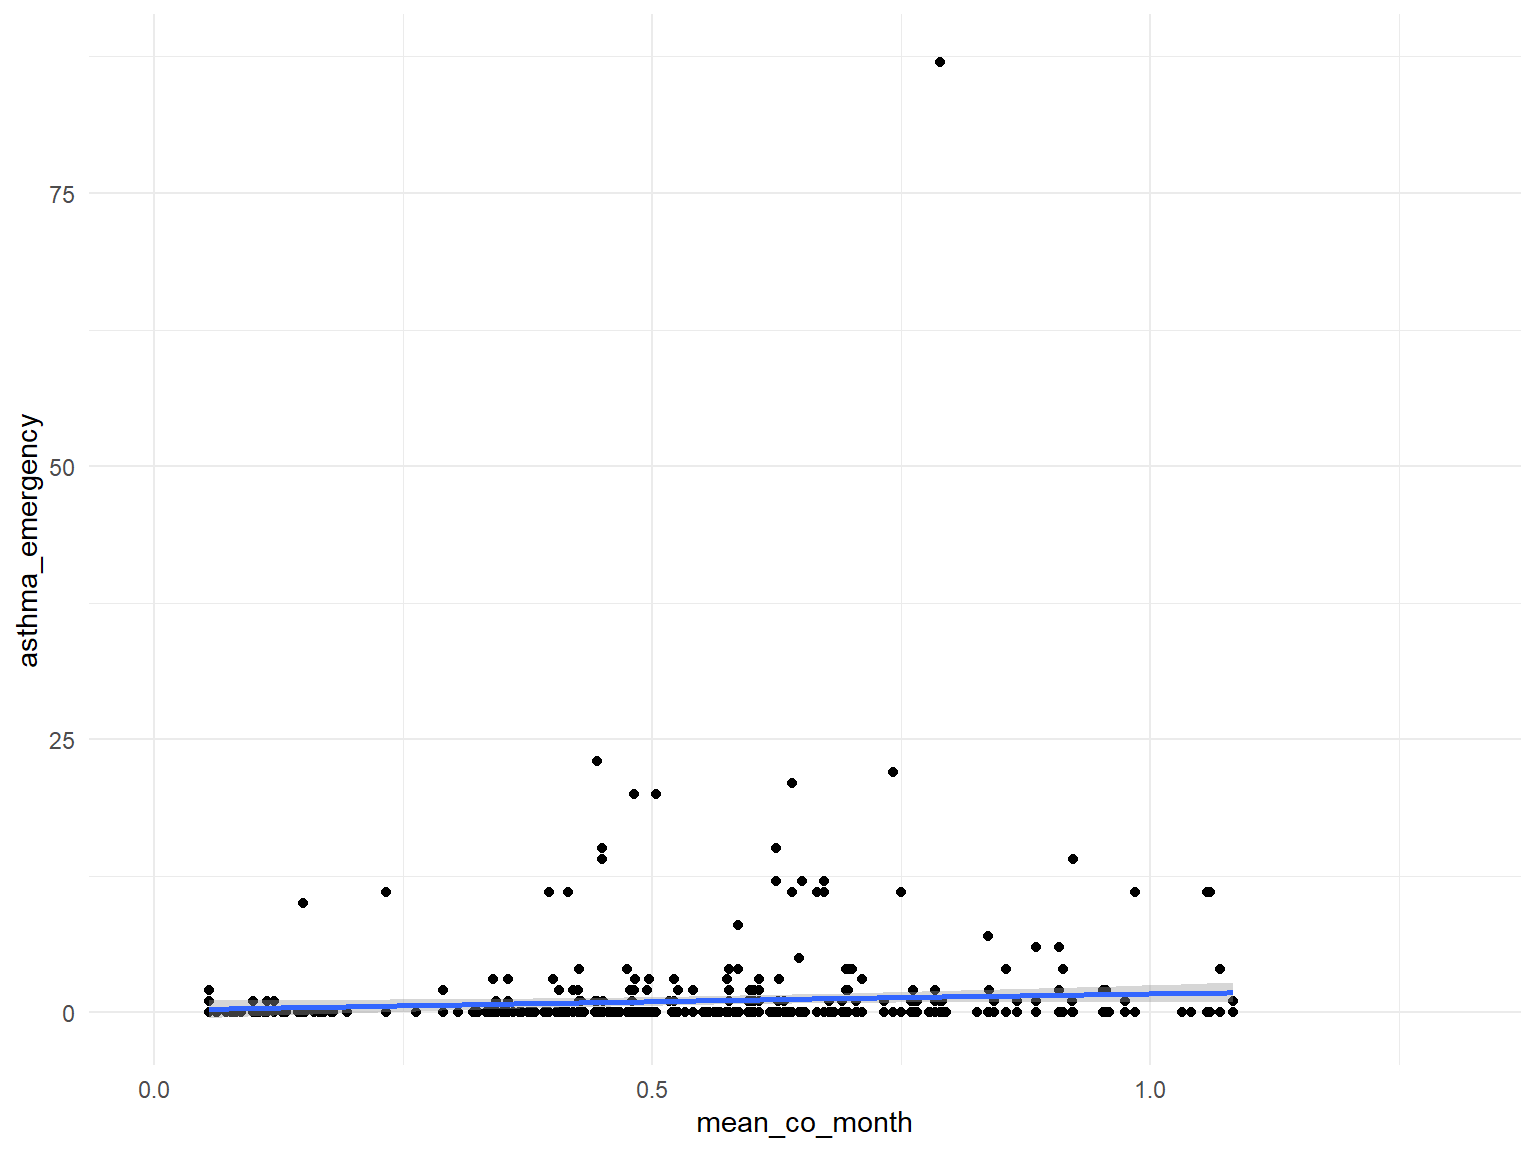
NO2
asthma_air_graph4 =
  brfss_air2_df %>%
  ggplot(aes(x = mean_no2_month, y = asthma_emergency)) +
  geom_point()+
  geom_smooth()

asthma_air_graph4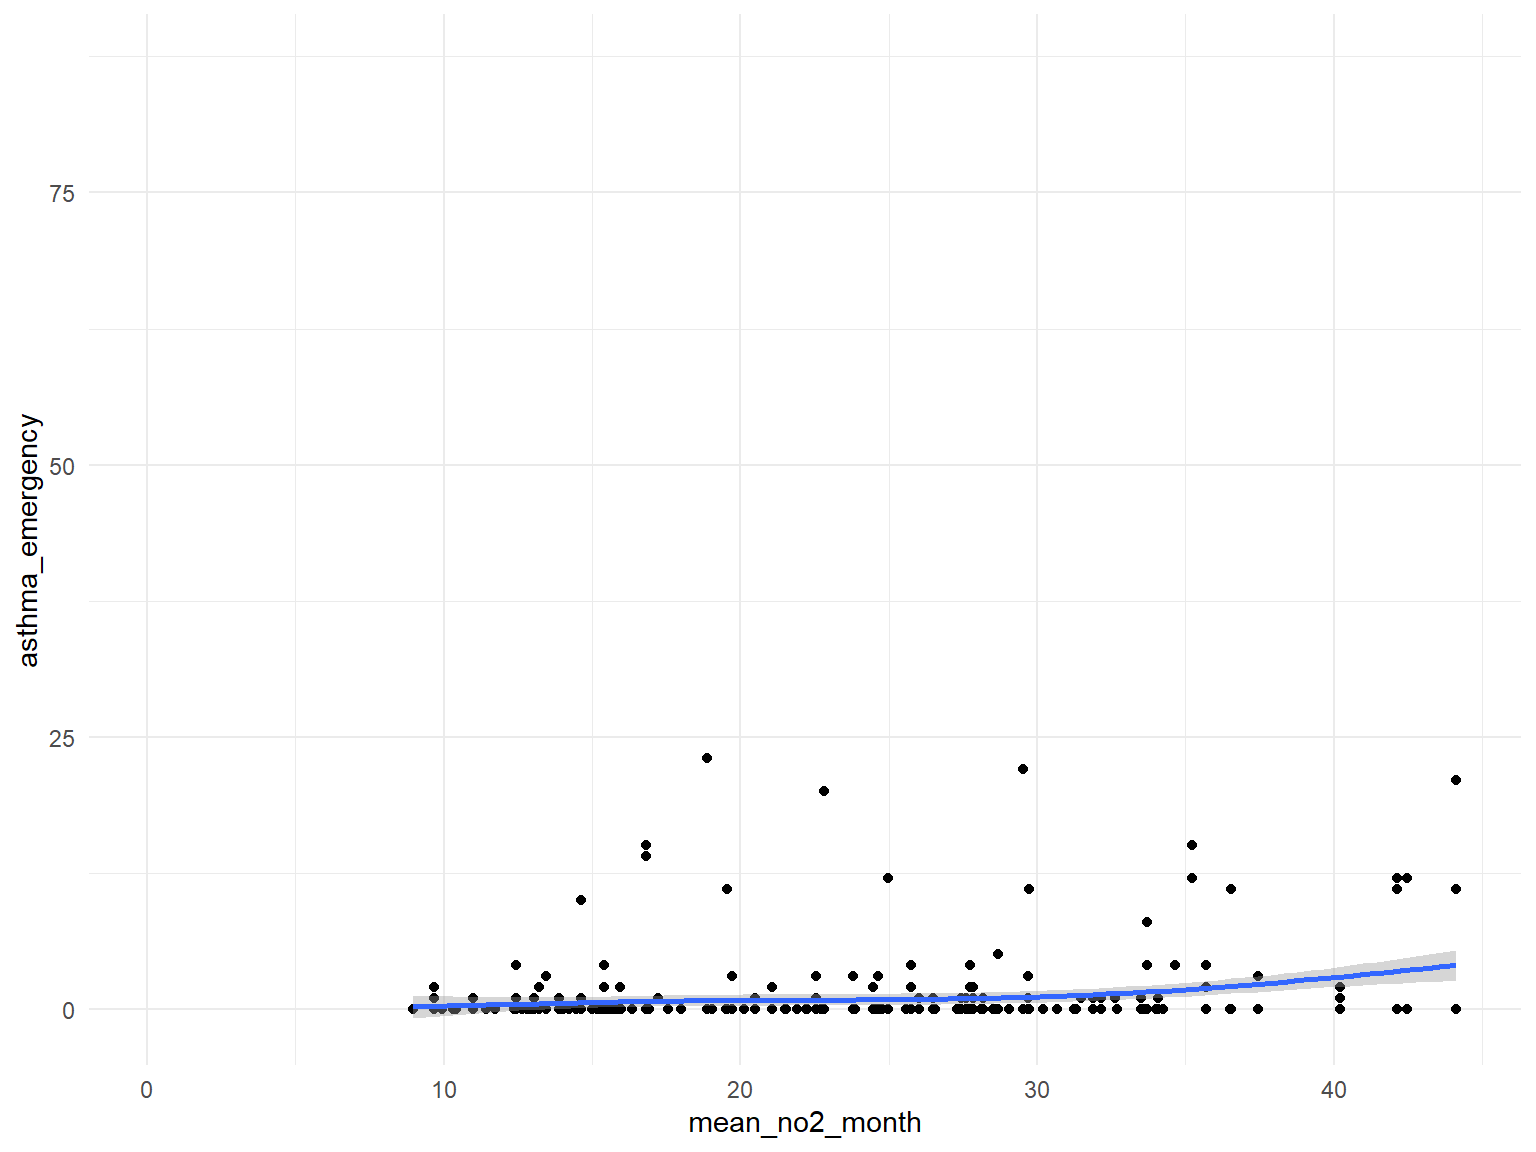
SO2
asthma_air_graph5 =
  brfss_air2_df %>%
  ggplot(aes(x = mean_so2_month, y = asthma_emergency)) +
  geom_point()+
  geom_smooth()

asthma_air_graph5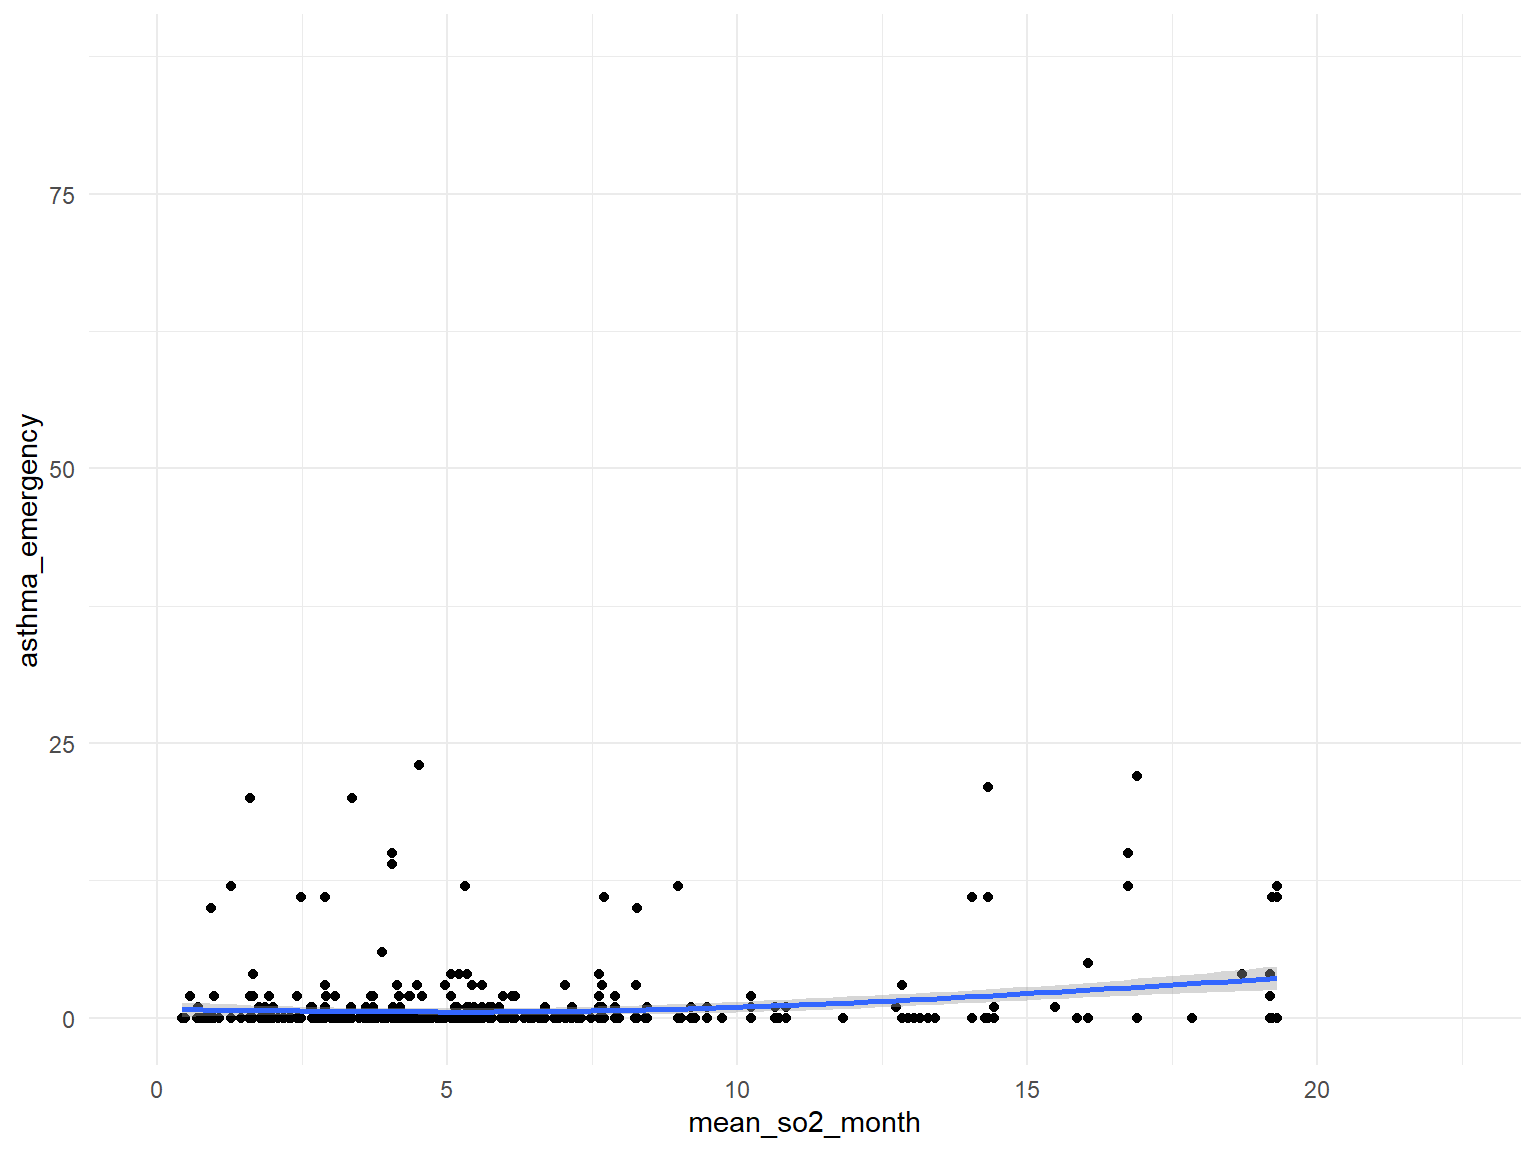
PM2.5
asthma_air_graph6 =
  brfss_air2_df %>%
  ggplot(aes(x = mean_pm2_5_month, y = asthma_emergency)) +
  geom_point()+
  geom_smooth()

asthma_air_graph6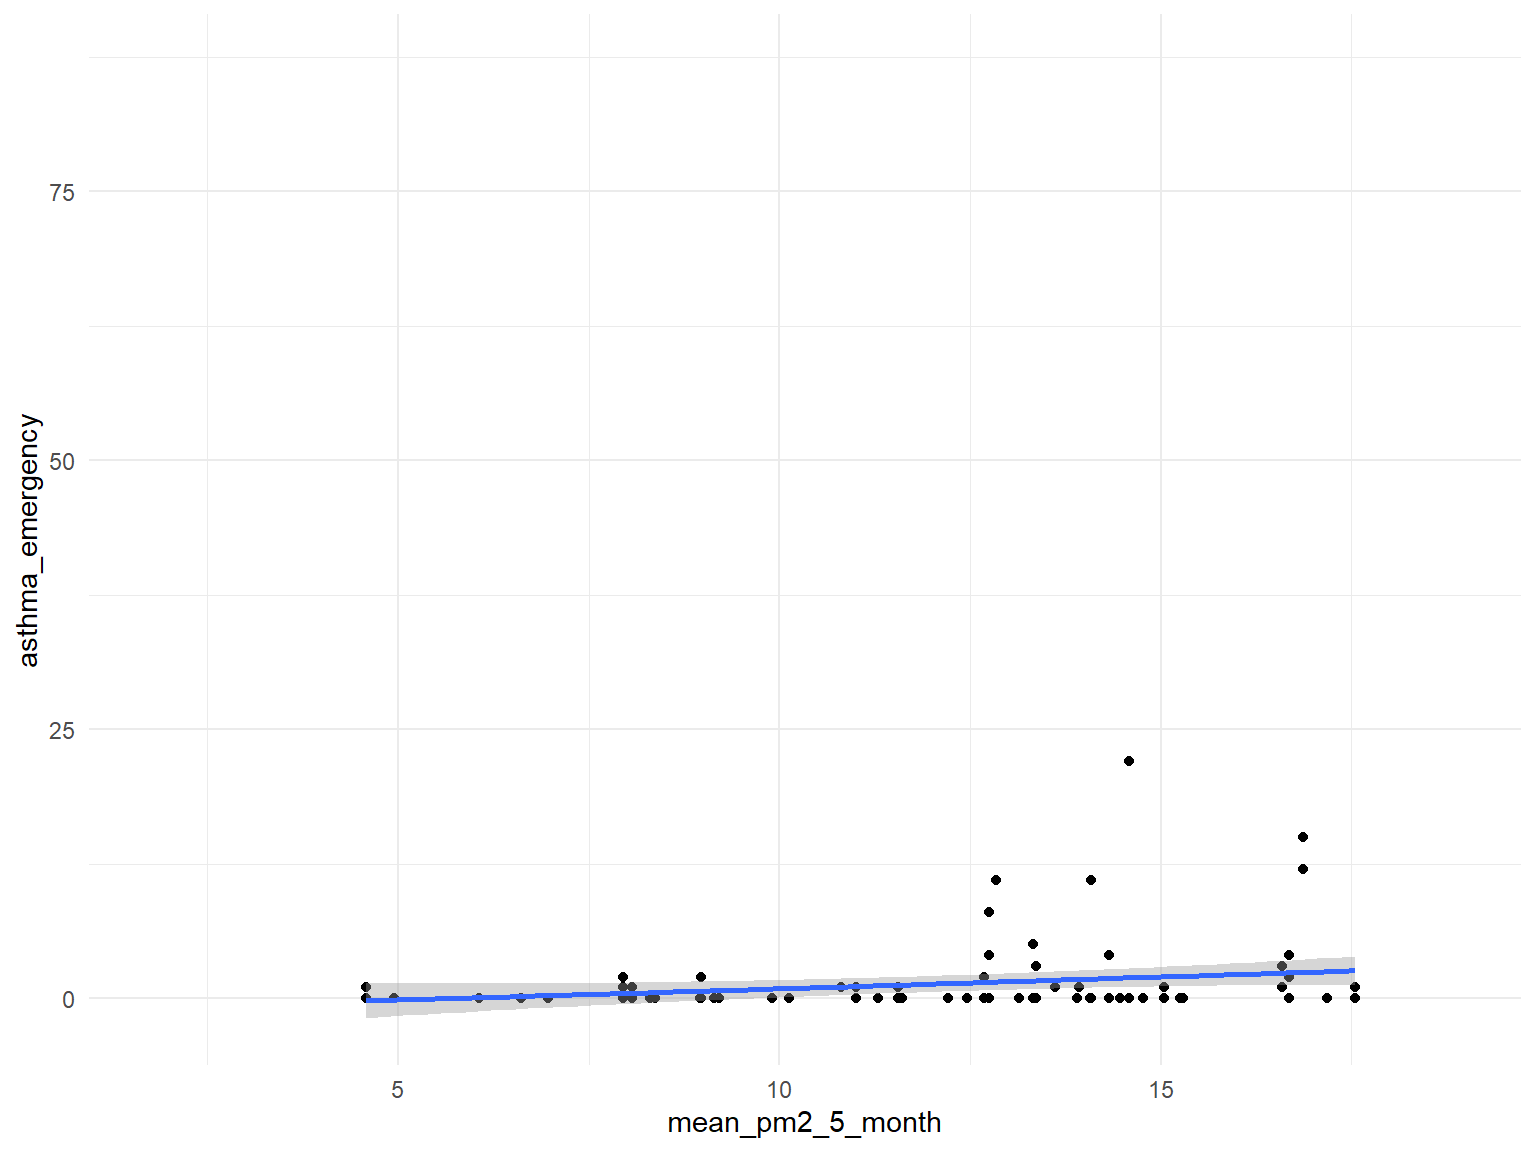
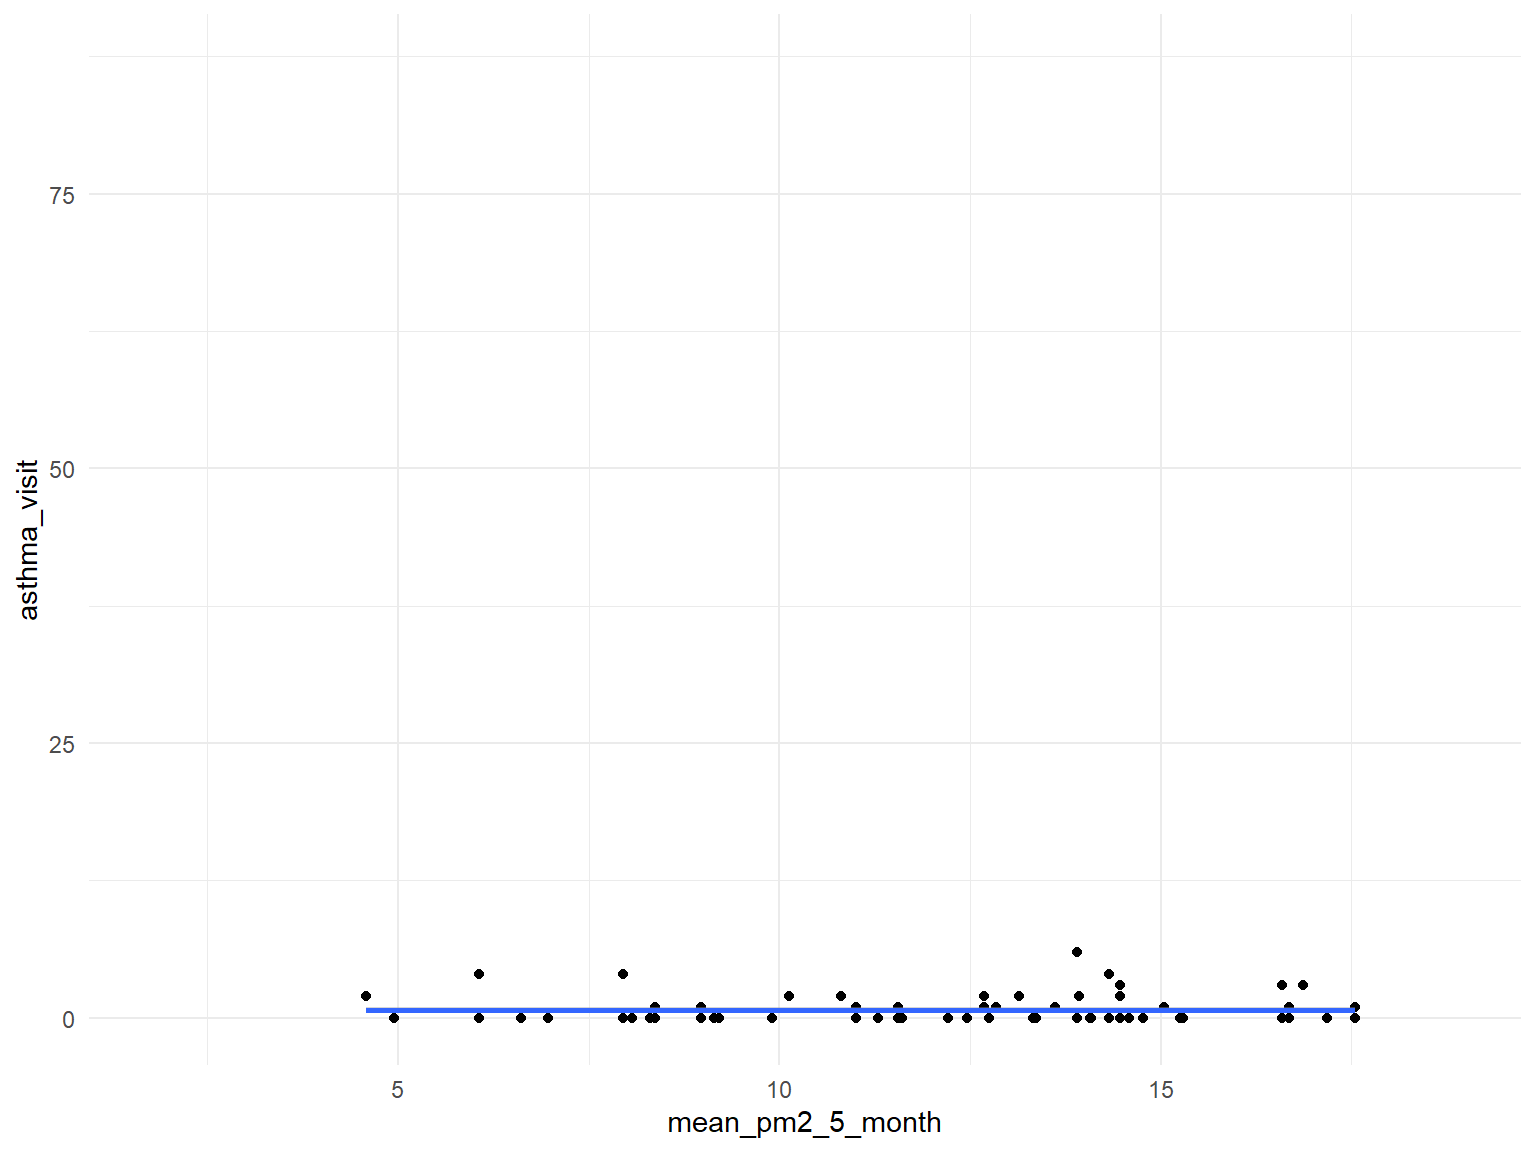
Figure 17: Association between air quality and Asthma doctor visit
- In order to find the association between air quality and asthma doctor visit times, we use several different predictors and plot graphs.
- Based on the graphs, we can find that all predictors are with no relationships with asthma doctor visit times.
air quality index
asthma_air_graph1 =
  brfss_air2_df %>%
  ggplot(aes(x = mean_aqi_month, y = asthma_visit)) +
  geom_point()+
  geom_smooth()

asthma_air_graph1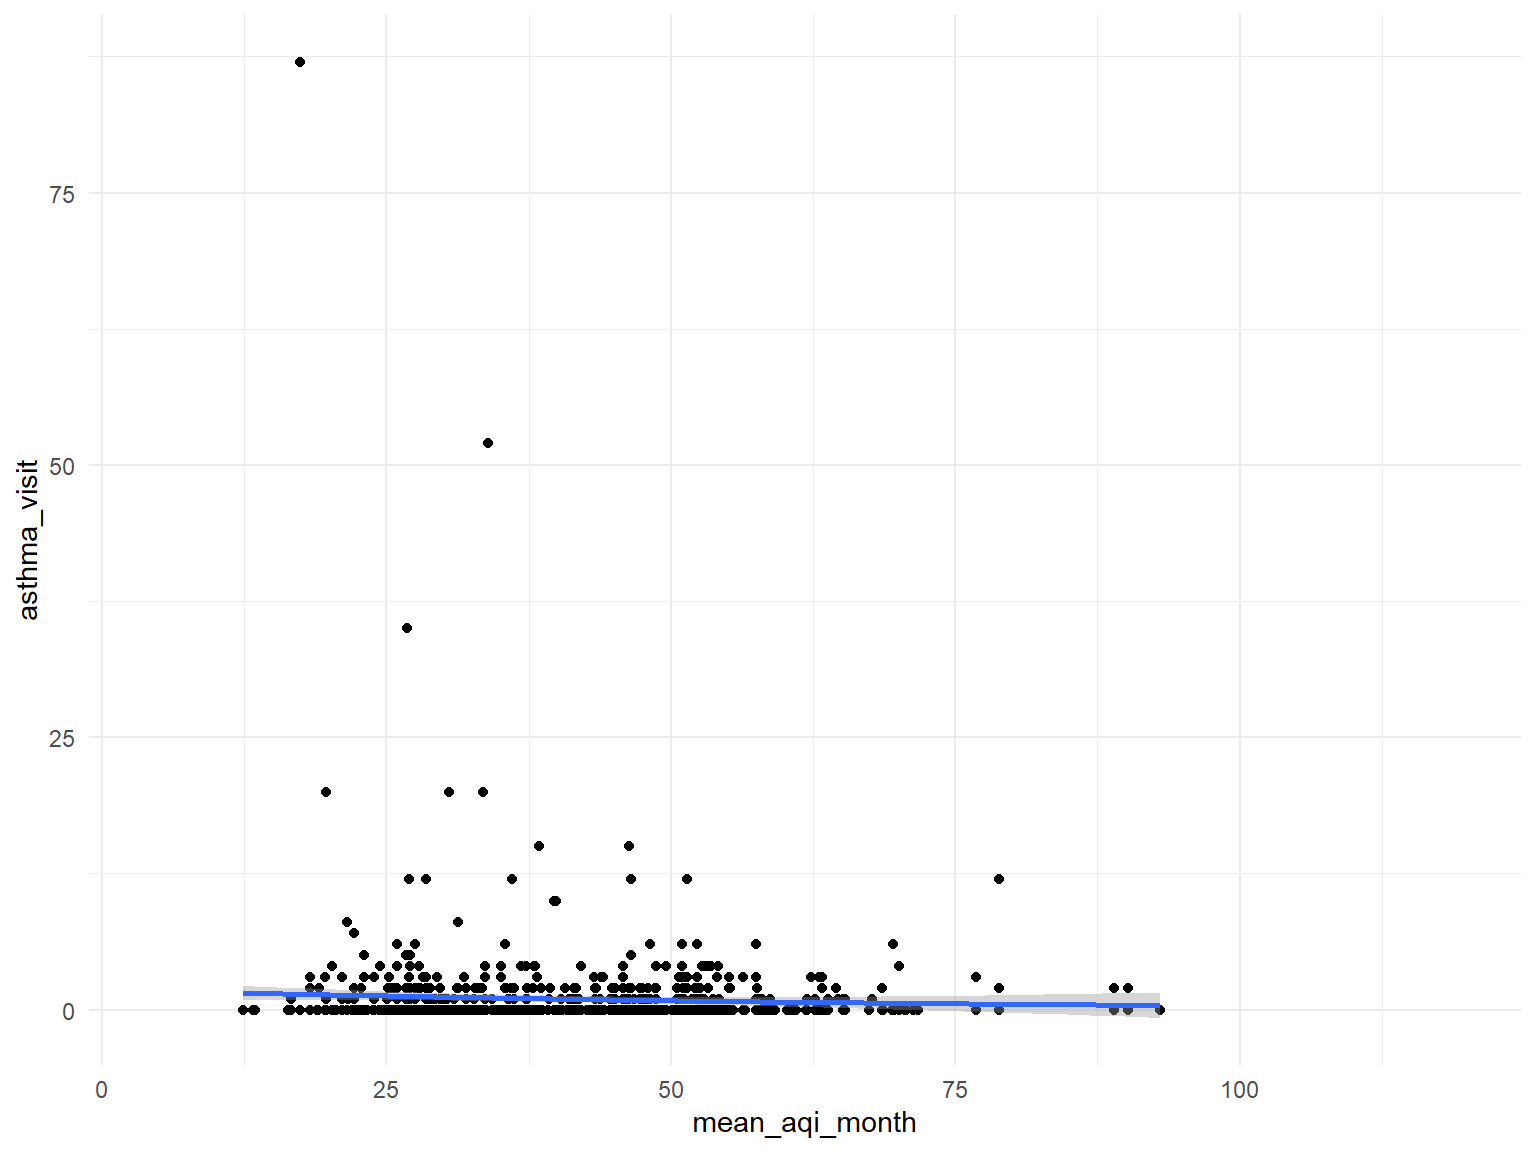
Ozone
asthma_air_graph2 =
  brfss_air2_df %>%
  ggplot(aes(x = mean_ozone_month, y = asthma_visit)) +
  geom_point()+
  geom_smooth()

asthma_air_graph2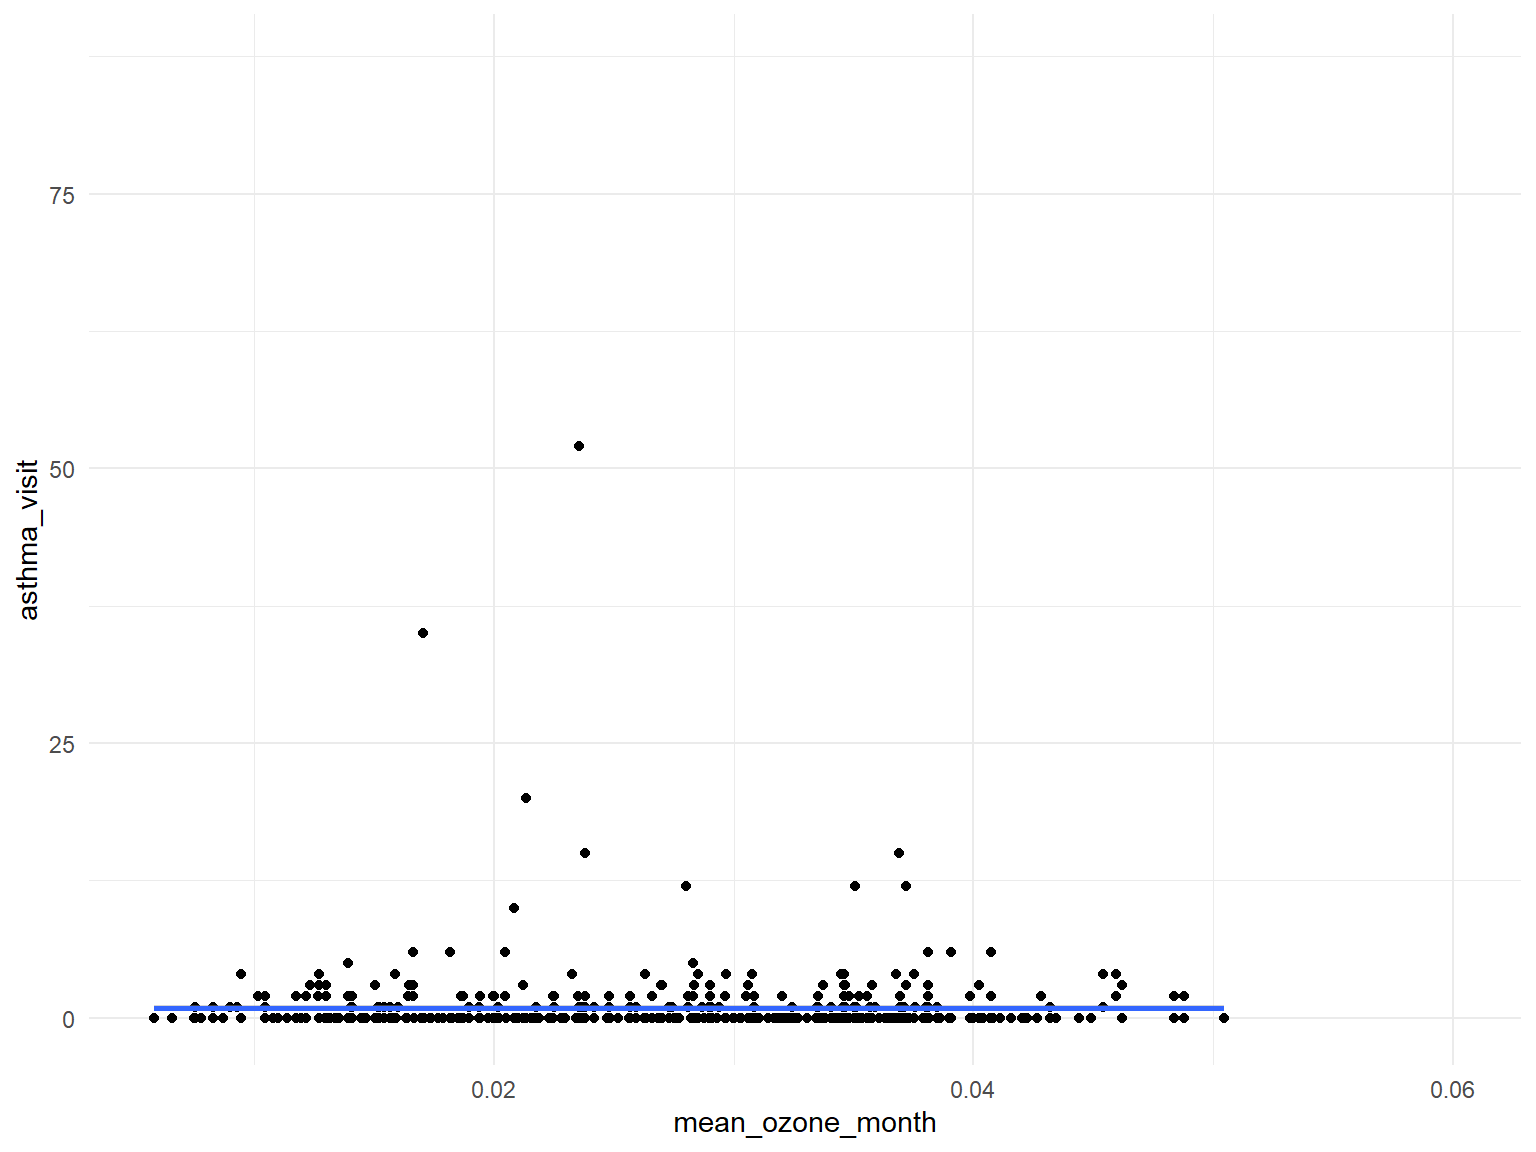
CO
asthma_air_graph3 =
  brfss_air2_df %>%
  ggplot(aes(x = mean_co_month, y = asthma_visit)) +
  geom_point()+
  geom_smooth()

asthma_air_graph3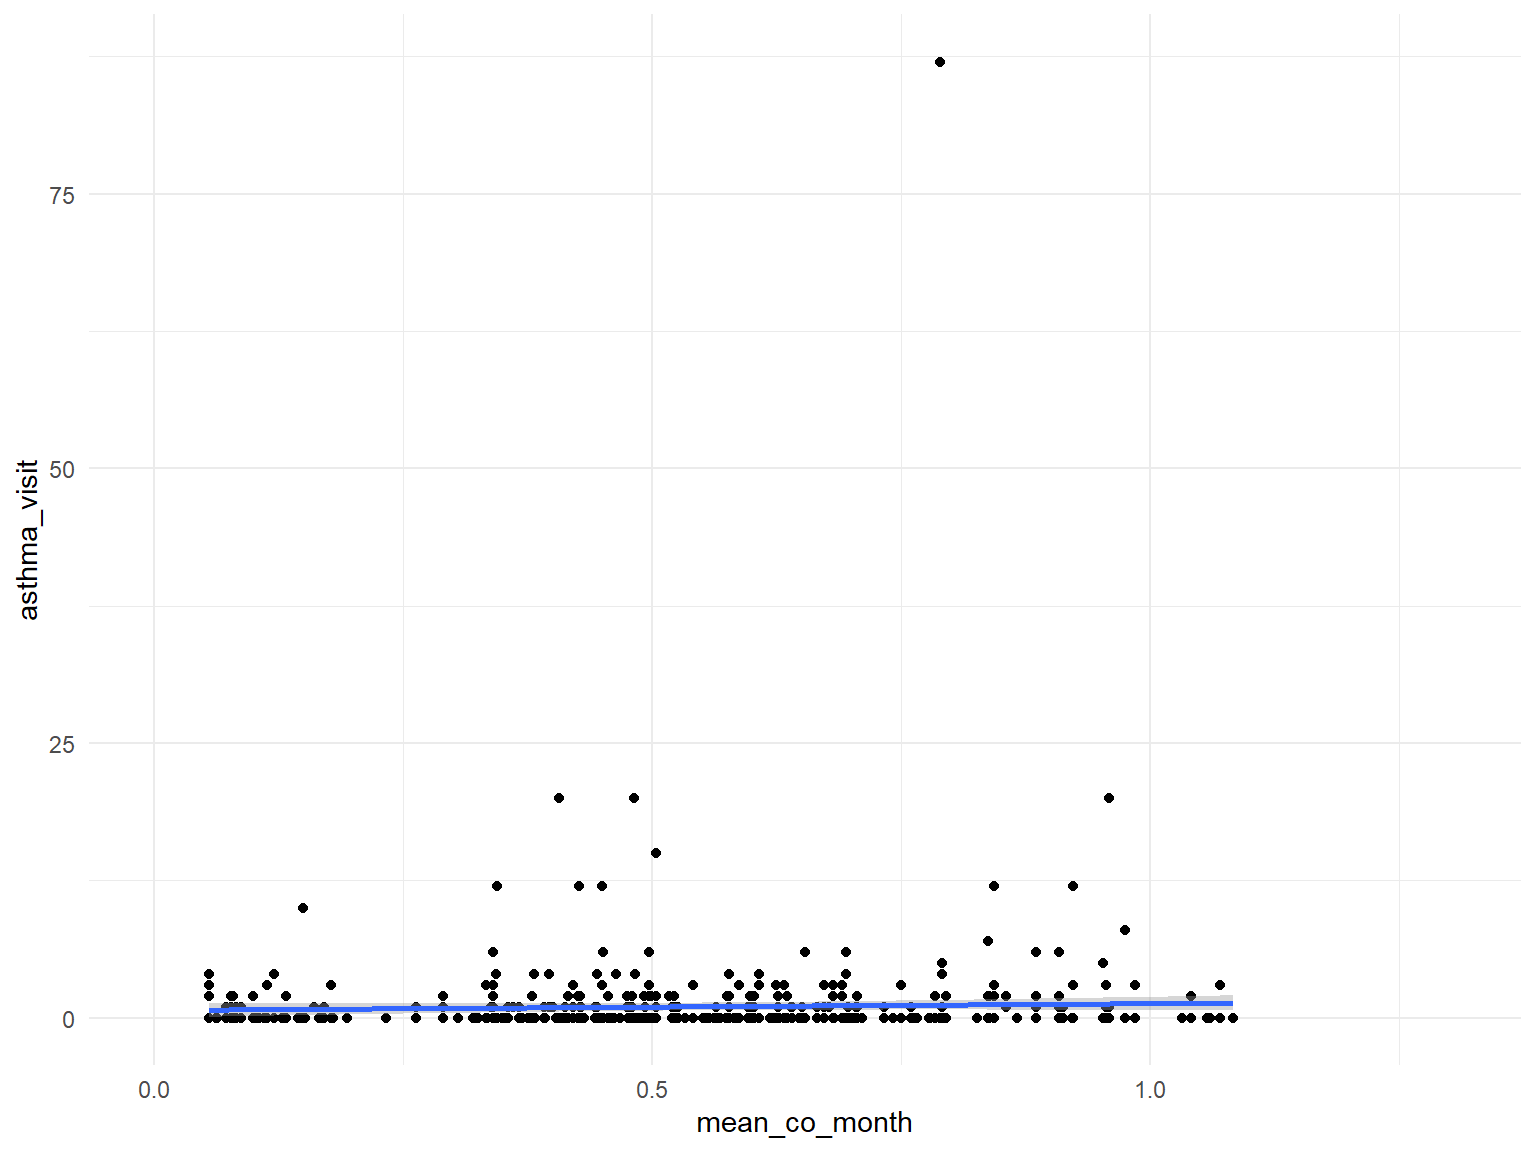
NO2
asthma_air_graph4 =
  brfss_air2_df %>%
  ggplot(aes(x = mean_no2_month, y = asthma_visit)) +
  geom_point()+
  geom_smooth()

asthma_air_graph4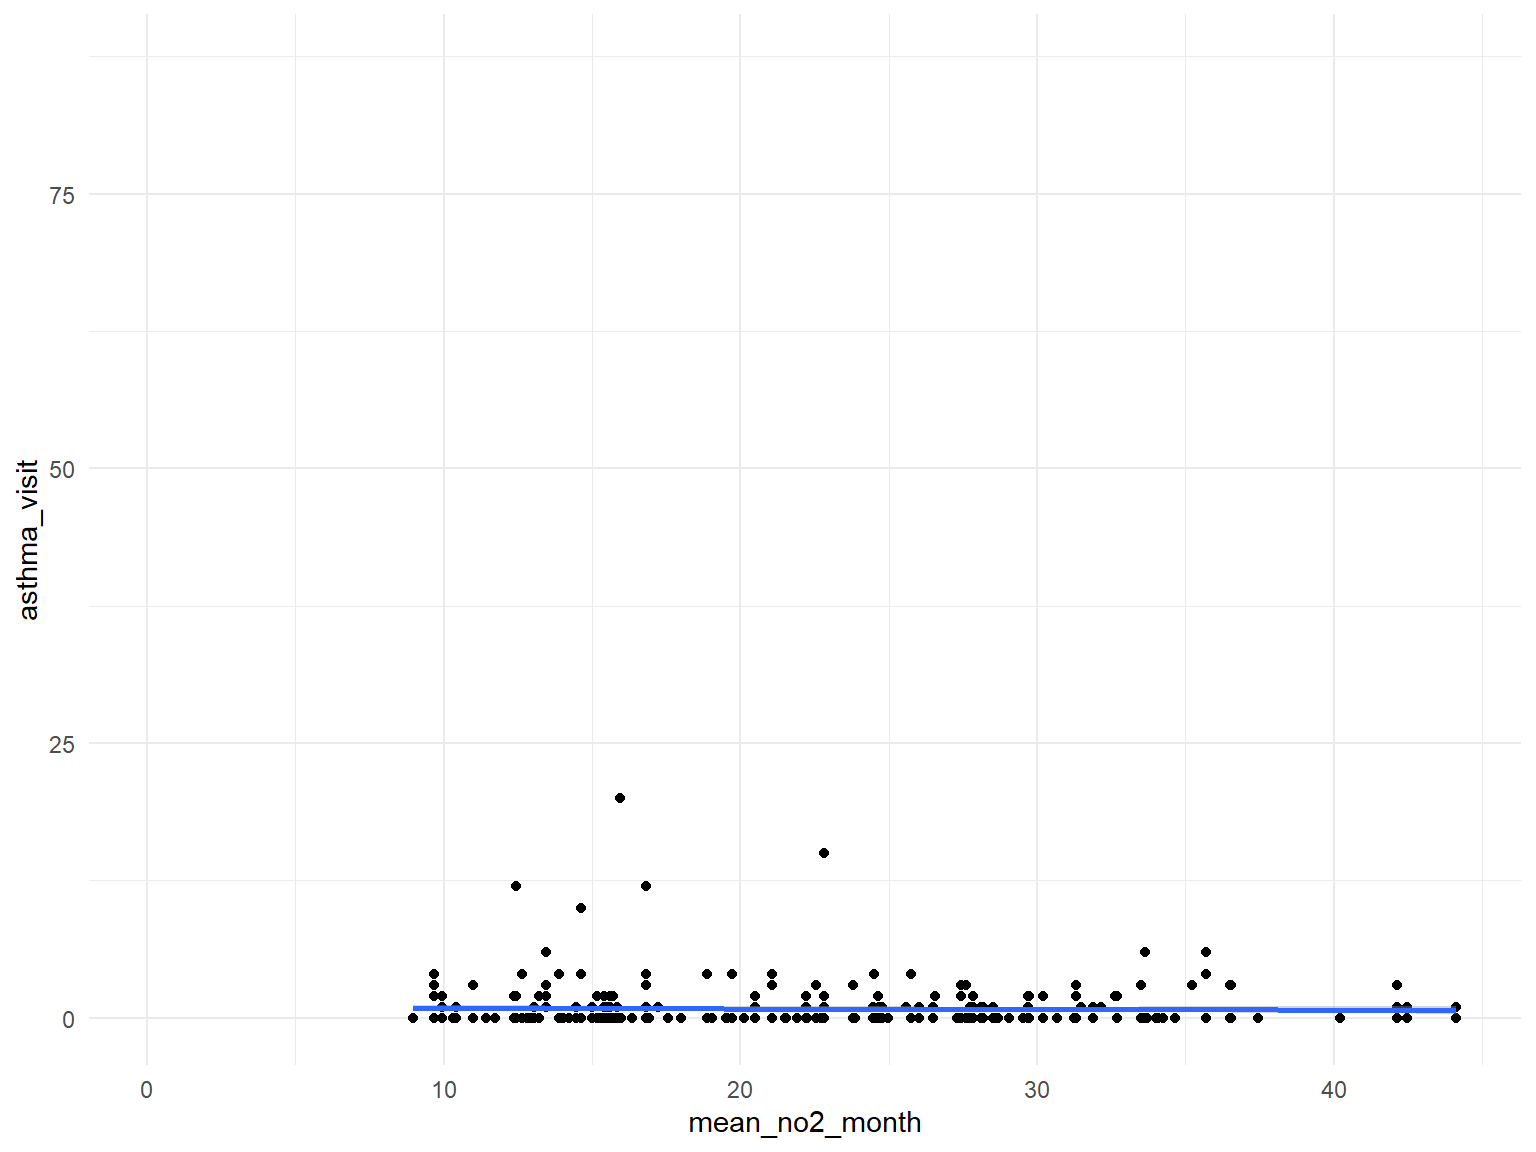
SO2
asthma_air_graph5 =
  brfss_air2_df %>%
  ggplot(aes(x = mean_so2_month, y = asthma_visit)) +
  geom_point()+
  geom_smooth()

asthma_air_graph5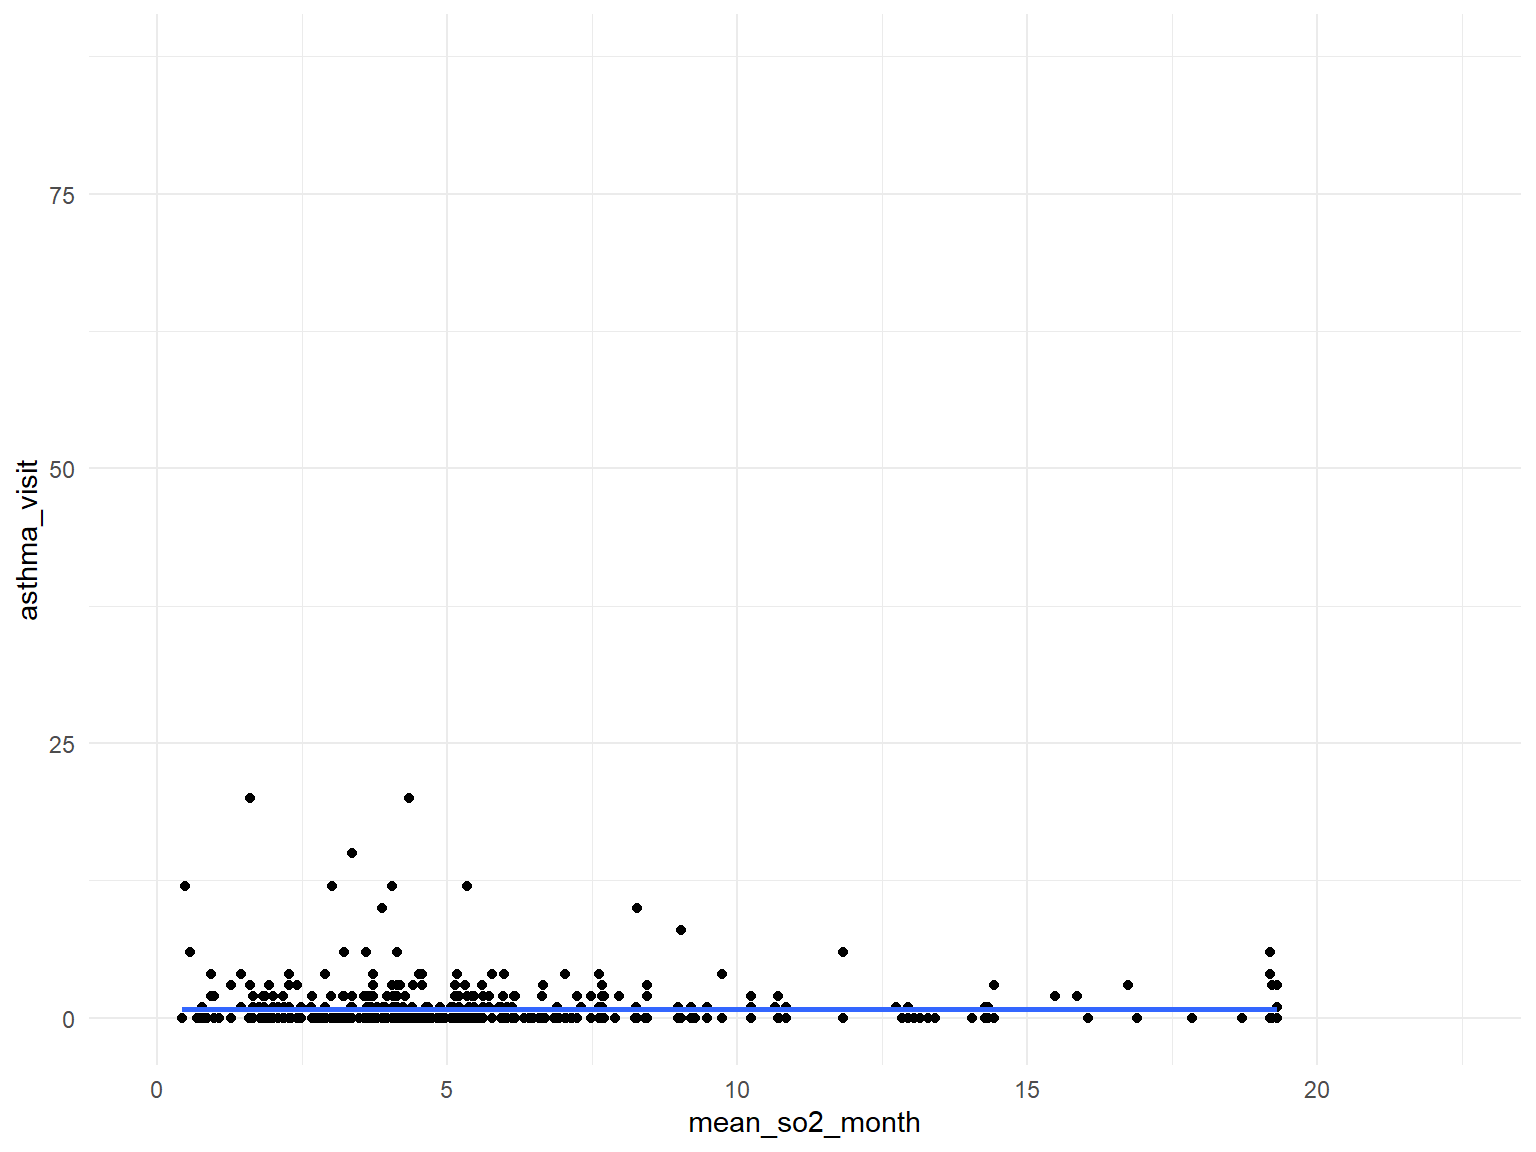
PM2.5
asthma_air_graph6 =
  brfss_air2_df %>%
  ggplot(aes(x = mean_pm2_5_month, y = asthma_visit)) +
  geom_point()+
  geom_smooth()

asthma_air_graph6